Sonaselection India Limited
Comprehensive Fundamental, Financial, Valuation & DRHP Research Report
FY25 Verified Data
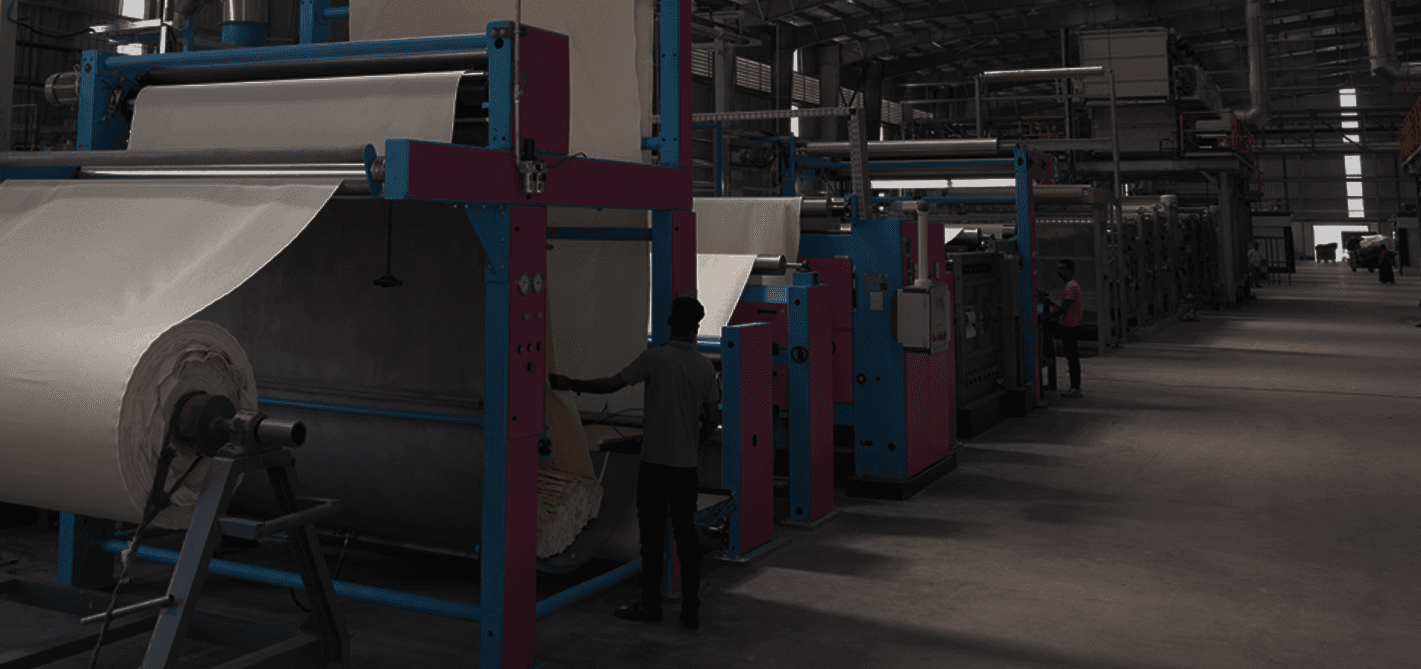
Where Tradition Meets High-Tech Innovation in the Fabric of Excellence
Sonaselection India Ltd (Sona Group) is an integrated fabric manufacturing powerhouse operating across 49,540 sq. meters with an annual processing run-rate of 82.44 million meters. Focused on high-margin 100% cotton, lycra stretch, and specialized blends.
▲ 161.16% 1-Yr YoY
▲ 41.76% Growth
3-Yr Avg: ~28.08%
High Plant Expansion Debt
1. Company Background & Integrated Manufacturing Model
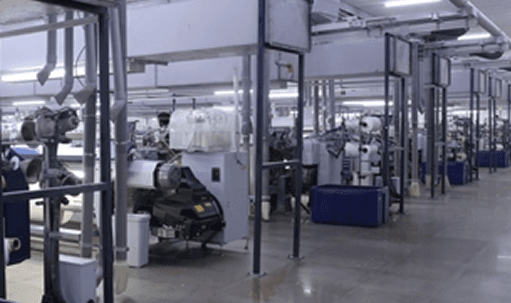
Sonaselection India Ltd operates as an integrated textile manufacturing and processing enterprise located at Bhilwara, Rajasthan—widely hailed as the “Manchester of Rajasthan” or “Vastranagari”. The facility is spread across 49,540 Sq. Mtr., boasting an aggregate annual processing capacity of 82.44 million meters.
The manufacturing process commences with the strategic procurement of yarn (converted to greige fabric via managed job-work partners) and third-party greige sourcing. Once received, all critical processing stages—including bleaching, continuous dyeing, mercerizing, singeing, and high-end specialty finishing—are conducted completely in-house to protect margin discovery and delivery timelines.
Advanced Machine Suite
Equipped with high-speed stenters, mercerisers, automated washing ranges, sanforisers, KD Jaguar decatizers, and Formula 1 Multipla pressing lines integrated with real-time digital quality monitoring.
Global Standard Testing Lab
Includes Titans Universal Strength Testers, Elmatear 1555 Digital Tear Testers, and computerized Auto Color Dispensers imported from Switzerland, the UK, and China.
High Capacity Utilization
Capacity utilization remained resilient at 81.65% (Q1 FY26), 71.50% (FY25), 89.50% (FY24), and 87.65% (FY23), underscoring strong order book visibility.
2. Fundamental Ratios & Balance Sheet Interpretation
| Fundamental Ratio / Metric | Reported Metric | Equity Research Interpretation |
|---|---|---|
| Return on Equity (ROE) | 34.08% (3-Yr Avg: ~28.08%) | Signifies top-tier capital efficiency and shareholder profit generation on its tangible net worth. |
| Return on Capital Employed (ROCE) | 17.88% (3-Yr Avg: ~18.55%) | Strong operational profitability delivered across total debt and equity deployed in heavy plant machinery. |
| Debt-to-Equity Ratio (D/E) | 2.96 | Reflects a highly leveraged capital structure driven by heavy long-term capex debt for its cotton unit. |
| 1-Year Revenue (Sales) Growth | 161.16% | Exceptional top-line surge as expanded plant capacities came fully online in FY25. |
| 1-Year Net Profit Growth | 41.76% | Solid bottom-line expansion supported by operating leverage despite substantial interest expenses. |
| Revenue 3-Year CAGR | 83.42% | Demonstrates sustained multi-year scaling (EBITDA CAGR of 79.31% and PAT CAGR of 172.00%). |
3. Multi-Year Statement of Profit & Loss (FY23 – FY25)
| Financial Parameter (₹ in Crores) | FY 2022–23 | FY 2023–24 | FY 2024–25 |
|---|---|---|---|
| Net Sales (Revenue from Operations) | ₹93.91 | ₹120.98 | ₹315.95 |
| Total Operating Expenditure | ₹75.83 | ₹92.78 | ₹258.27 |
| Operating Profit (EBITDA) | ₹18.09 | ₹28.20 | ₹57.68 |
| Finance Costs (Interest Outflow) | ₹2.65 | ₹4.79 | ₹15.12 |
| Depreciation & Amortization | ₹3.59 | ₹6.80 | ₹17.31 |
| Profit Before Tax (PBT) | ₹12.04 | ₹16.95 | ₹26.08 |
| Profit After Tax (PAT) | ₹2.51 | ₹13.10 | ₹18.56 |
| Adjusted Diluted EPS (₹) | ₹0.62 | ₹3.25 | ₹4.50 |
Balance Sheet Structure & Physical Asset Creation
Capital Allocation Insight: Operating cash flows and debt were aggressively channeled into fixed assets (CWIP), raising gross block by >3.4x over 24 months. Cash dividends remain nil to prioritize working capital and debt servicing.
4. Corporate Journey & Milestones

The Visionary Inception
Subhash Nuwal embarked on the textile processing journey, building foundational customer trust in Bhilwara.
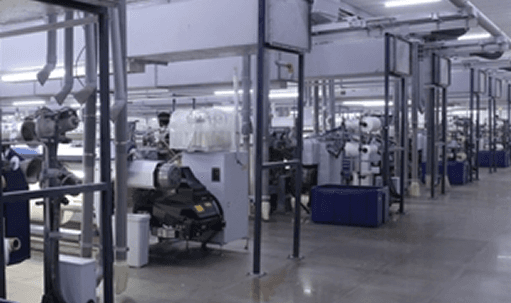
Sona Processors Ltd.
Established specialized synthetic and PV suiting unit, achieving a processing capability of over 5 million meters/month.
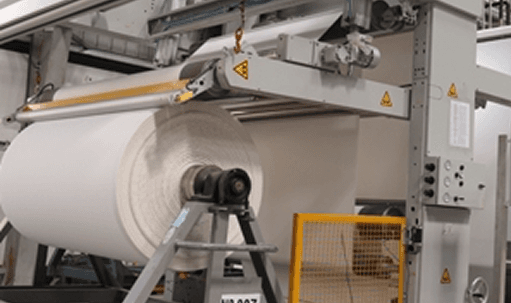
Natural Fiber Penetration
Pivoted into premium 100% cotton fabric processing to capture high-margin export and domestic branded markets.
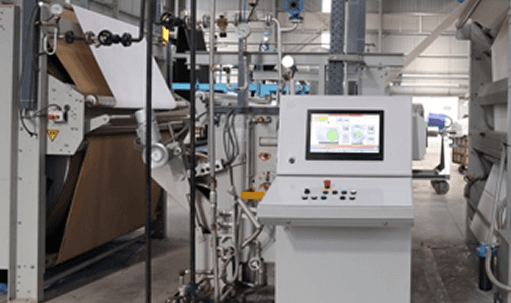
Airjet Weaving & Acquisition
Commissioned Sona Styles Ltd with high-tech Airjet looms (0.7M meters/mo) and acquired an operational plant unit.
10.15M Meters/Month Run-Rate
Scaled processing to 10.15 million meters monthly, including a 5M meters/mo dedicated high-capacity cotton processing line.

Expanded Weaving Roadmap
Planned rollout of 1.8M meters/month weaving capacity with computerized sizing machines to service global export brands.
5. Board of Directors & Executive Leadership

Subhash Chandra Nuwal
Promoter & Chairman
Over 35 years of industrial leadership. Oversees operations handling 12 million meters monthly across the broader Sona group.

Harshil Nuwal
Promoter & Managing Director
Spearheaded the state-of-the-art weaving division and the modern high-efficiency cotton processing expansion in May 2024.

Deepank Bhandari
Promoter
Brings international financial market expertise across European private equity, investment banking, and 9+ years in Indian e-commerce.
Core Investment Positives
- Robust Return Ratios: Return on Equity standing exceptionally high at 34.08% confirms optimal profit extraction from its tangible equity base.
- Exponential Top-Line Acceleration: Net sales scaled by 161% to reach ₹315.95 Cr in FY25, delivering an 83.42% 3-year CAGR.
- Strategic Cluster Proximity: Situated in Bhilwara (Rajasthan) offering unmatched logistical access to raw cotton, synthetic yarn, and industrial job-work networks.
- Integrated Infrastructure: Over 82.44M meters of annual processing prevents margin erosion across the finishing chain.
Critical Risk Factors & Monitorables
- Substantial Financial Leverage (D/E 2.96): Total debt of ₹130.77 Cr led to annual interest servicing outflows of ₹15.12 Cr in FY25, which can pressure margins during high-interest cycles.
- Raw Material Fluctuation: Unhedged domestic and international cotton and polyester-viscose (PV) yarn price volatility directly affects EBITDA consistency.
- Nil Cash Dividend Policy: Capital expenditures and working capital demands will suppress cash distributions to shareholders in the near term.
- Execution on Weaving Expansion: Successful commissioning of the planned 1.8M meters/mo weaving facility remains critical for sustained margin uplift.
6. Primary Market (IPO), GMP & DRHP Intelligence
With the company crossing ₹300+ Cr in operational revenues and submitting its Draft Red Herring Prospectus (DRHP), institutional allocators are tracking its equity dilution roadmap to monitor balance sheet deleveraging.
Regulatory Disclaimer: This fundamental analysis report has been synthesized strictly for research, informational, and educational evaluation purposes based on public corporate disclosures, audited financials (FY23–FY25), and Draft Red Herring Prospectus (DRHP) filings. It does not constitute formal financial advisory or investment recommendation. Financial market investments are subject to risk. Always consult a SEBI-registered investment advisor before subscribing to equity offerings.
SEBI Compliance Note: ipoind.com is an independent financial analytics and primary market research portal provided solely for educational and informational purposes. We are NOT a SEBI-registered Investment Advisor or Research Analyst. Financial market investments, equity securities, and Initial Public Offerings (IPOs) carry inherent market risks.
Grey Market Premium (GMP) Notice: Figures regarding Grey Market Premium (GMP), Kostak rates, and subject-to-sauda deals reflect unofficial, unregulated over-the-counter market sentiment. These figures do not guarantee exchange listing prices or actual trading outcomes. Always evaluate official Draft Red Herring Prospectus (DRHP / RHP) documents filed with BSE/NSE and consult a certified financial advisor prior to executing financial bidding decisions.